

Updated on: May 15, 2021 ; Investments
Background:
We have discussed one PE-based investment strategy in the previous article. That strategy didn’t seem to have any substantial benefits over a simple SIP strategy in equities. So, in this article, we will look at a variation of that strategy and find out if it is any better than the last strategy. We call this new strategy, the PE based equity switching strategy. Later I will explain at length, why are we using the term equity and what does switching imply here.
But before that, in case you are new to PE ratios. Please read these articles on the meaning of PE and its possible usage as an indicator. This will help you better grasp the message I am trying to convey here.
PE based equity switching
In the previous strategy, “PE-based investment channelling“, we channelled the flow of new monthly capital, either into debt or equity assets. We based the channelling on Nifty 50 PE levels. We will follow the same principle here as well.
There were no withdrawals once the funds were invested in an asset class. This is where we are going to alter the strategy a bit.
For our new readers, I will provide a background on the base assumptions in the next few paragraphs. Readers familiar with it can skip the next five paragraphs.
We provide the investor with a choice of two fundamental financial assets only. One is an equity asset, and the other is a debt instrument.
For equity, we have considered the Nifty 50 index. And for debt, we have assumed a risk-free debt instrument that gives an 8% return annually.
In the real world, there are many more choices available to an investor. But, we are going ahead with these two basic assets to avoid any unnecessary complexities.
As far as data is considered, we have used monthly data for Nifty 50 starting from January 2001 till January 2021. The Nifty 50 level and its corresponding PE ratios are recorded at the start of each month.
The assumption is that the investor has 1000 rupees at the beginning of each month to invest. He/She can either choose to channel the investment in the equity bucket or the debt bucket. The default choice is to invest it in the equity bucket. This default choice will be our base case.
In the PE based equity switching strategy, the investor will invest the monthly contribution into the debt instrument when Nifty 50 PE is above a certain threshold value.
When the Nifty 50 PE level falls below the threshold then the monthly investment will go into the equity bucket. Not only that, but along with it the entire corpus in the debt asset will also be moved into the equity bucket. We call it the PE based equity switching strategy because we move the entire debt corpus into equity asset class at opportune times.
The only deviation from the previous strategy is the allowance of a complete withdrawal of debt funds into equity funds. This is unlike the previous strategy, where no withdrawals were considered.
Normally every withdrawal has a cost associated with it. Different funds have different exit loads when you withdraw funds out of them. In this case, we have considered an exit load of 0.5% for withdrawals from debt funds. This is in line, if not more than the prevailing market rates.
Based on the previous article “Can PE act as an indicator“, we have chosen two PE levels as the threshold levels. They are 22 and 18. The investor will channel the investments based on these threshold values. We will compare the investment values throughout the analysis period with the base case. In the base case, the investor continues with the simple monthly SIP of 1000 rupees in the Nifty 50 index.
We will also take a look at a small variation of the above strategy. In this, the switching decision is based on the 12-month moving average PE of Nifty 50. This is to ensure that channel switching happens only when the PE threshold has been breached for a long time.
Now, let’s have a look at the graphs and see if this strategy is any better or worse.
Strategy in action:
The graph below shows the performance of the monthly PE based equity switching strategy.
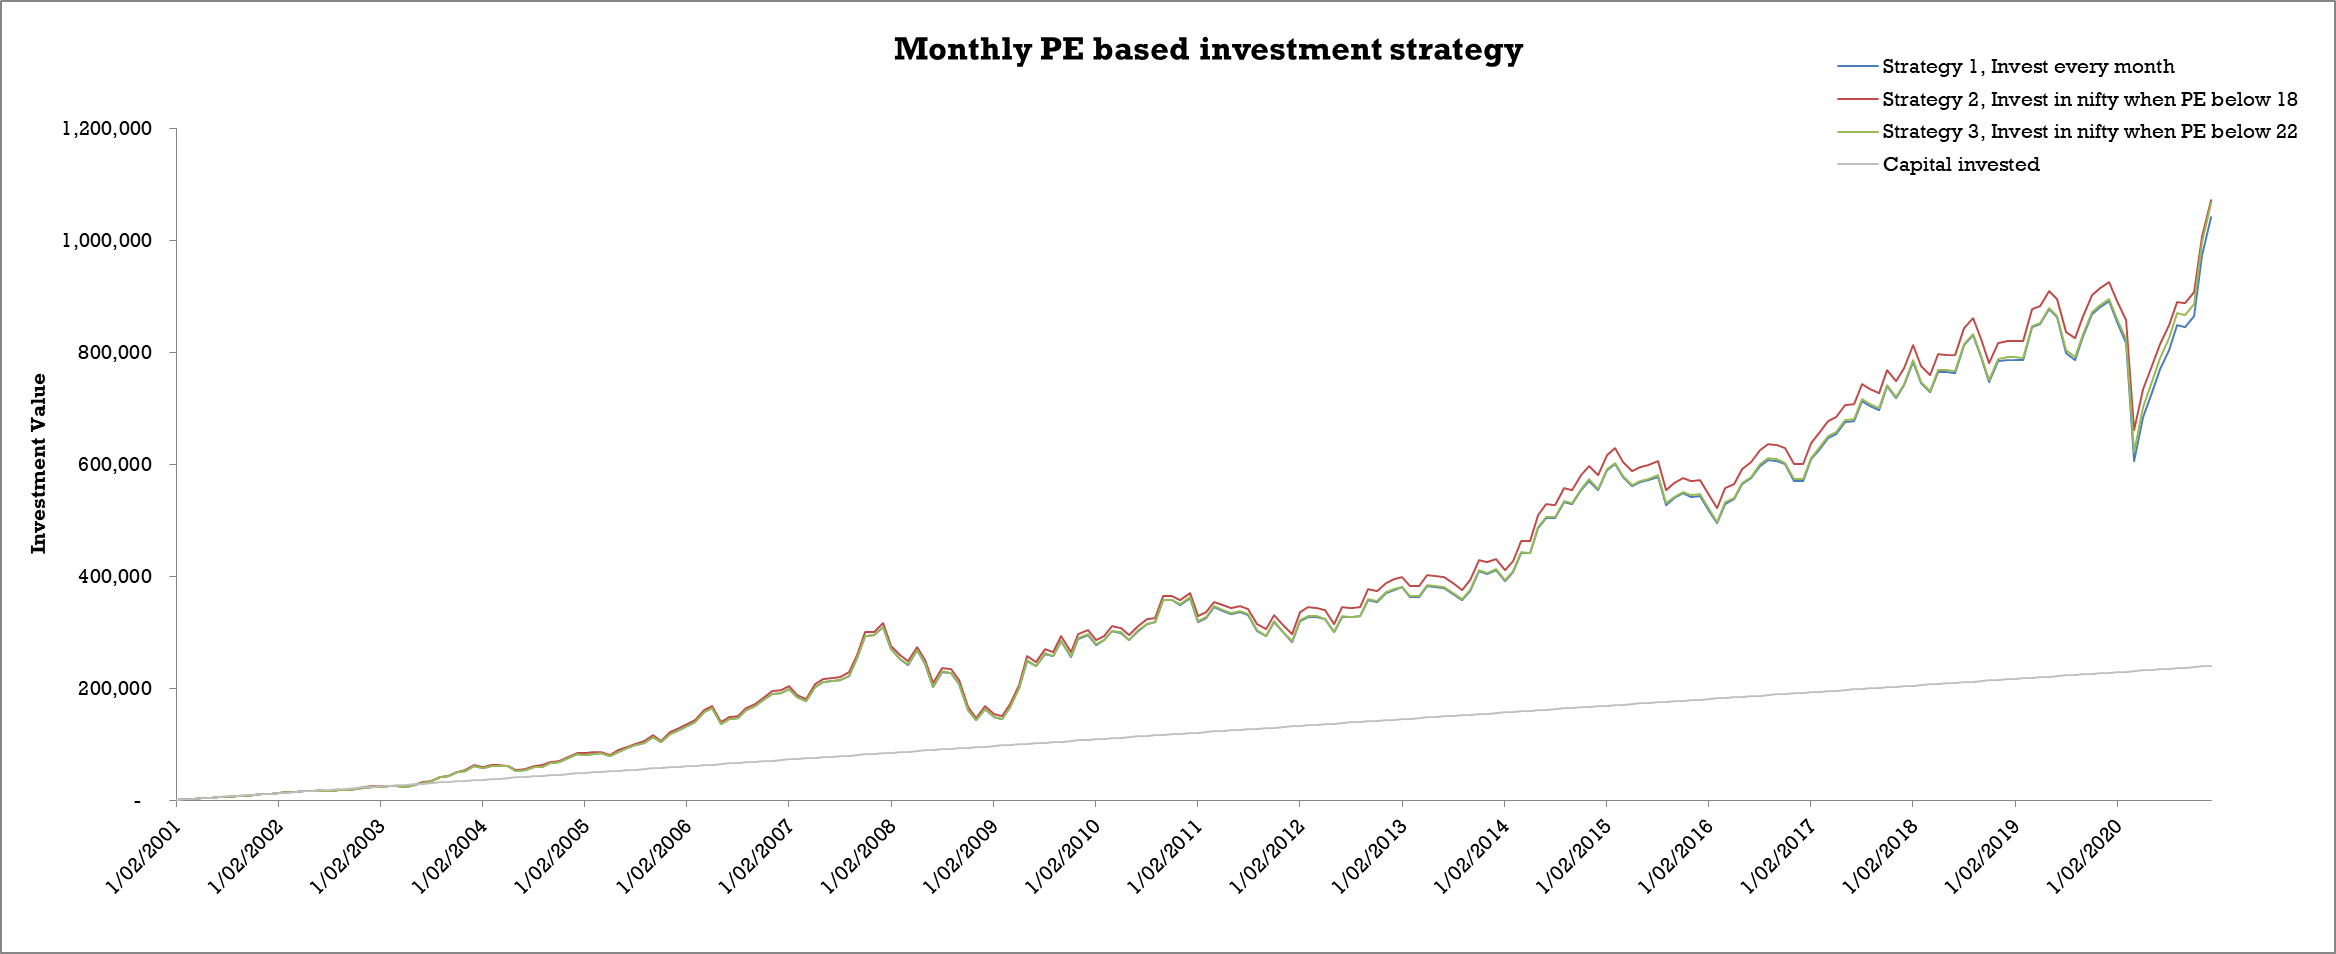
You can see a noticeable difference in the performance of these strategies. Strategy 2 (PE threshold of 18) works better than the other two strategies throughout the 20 years time period. This strategy has not only given superior returns during good times but also provided better downside protection during sharp falls in markets.
There is not much of a difference in the performance of Strategy 1 and Strategy 3.
Just a reminder, this analysis takes into account an exit load of 0.5%. Exit load is applied every time the switching of funds happen from debt to equity. So, there is some merit in deploying this PE based equity switching strategy. The strategy at PE = 18 looks promising, unlike the previous PE based channelling strategy.
Next, let’s see how does this strategy work when we use moving average PE (12 months) instead of monthly PE.
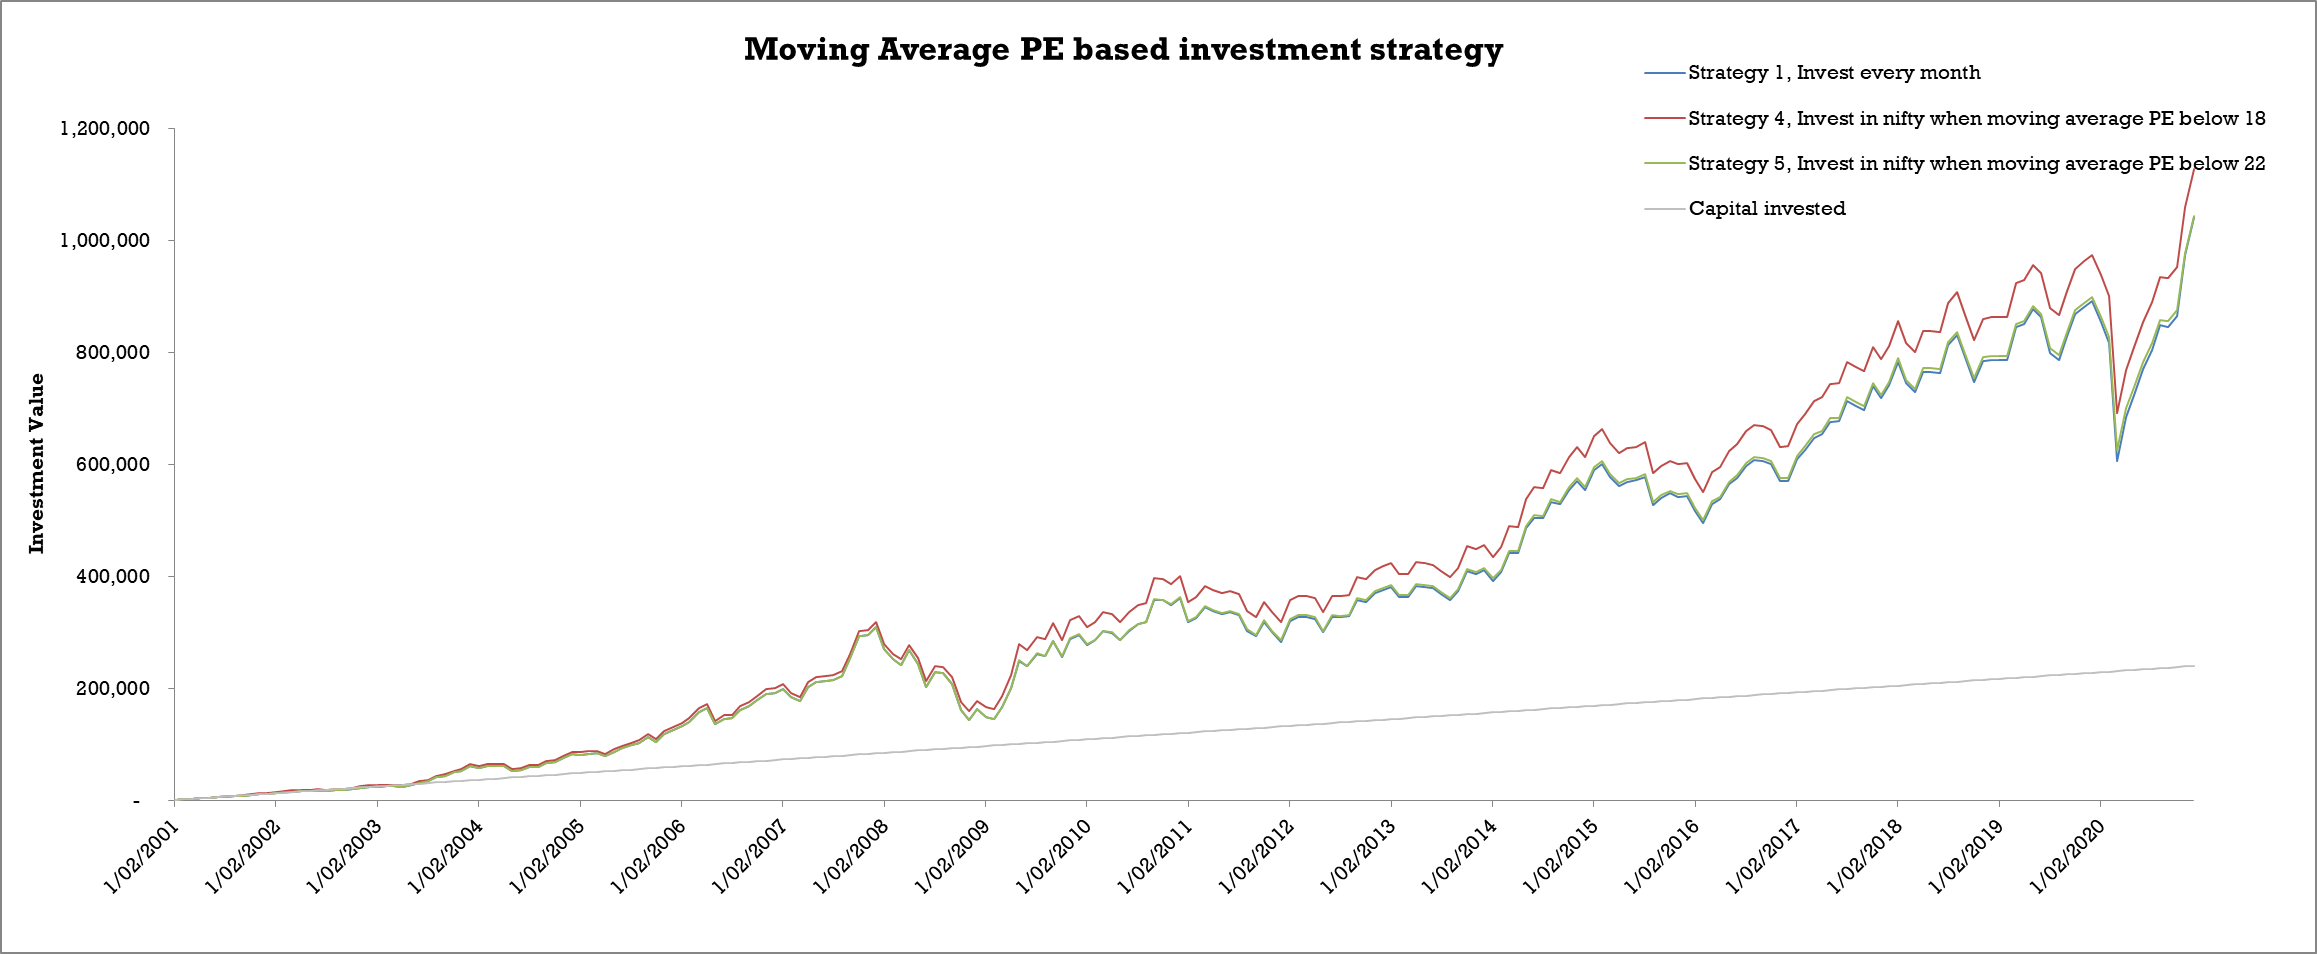
The results look even better in the case of moving average PEs. There is a big gap between the performance of Strategy 4 and the other strategies. Before proceeding, let’s look at the actual investment values at the end of 20 years investment time horizon.
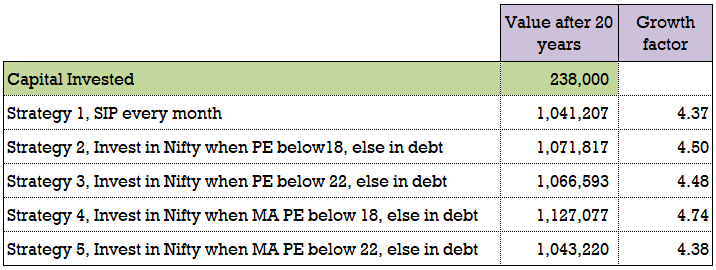
The total capital invested over a period of 20 years comes out to be 238,000 rupees. All the strategies have resulted in handsome returns of 4x plus. Strategy 2 and Strategy 4 turn out to be the clear winners here. This makes the PE-based equity switching strategy at the PE threshold of 18 an attractive proposition.
But as said before, don’t draw any conclusions yet.
You need to look at another set of numbers. If you have gone through the previous posts on SIPs in mutual funds, you would know that the value of your investments depends on the time frame of the investments.
To complete our analysis, we will look at the scenario when the investment’s start time coincides with a market peak. For this, we have chosen a time before the financial crisis of 2008. This would have been one of the worst possible starts for any investor to get into the markets. So choosing this time-frame would help us understand the performance of the investments under unfavourable conditions.
So, we repeat the same analysis with a different start time. With this, the investment time period reduces to 13 years from 20 years. Time to look at the graphs now:
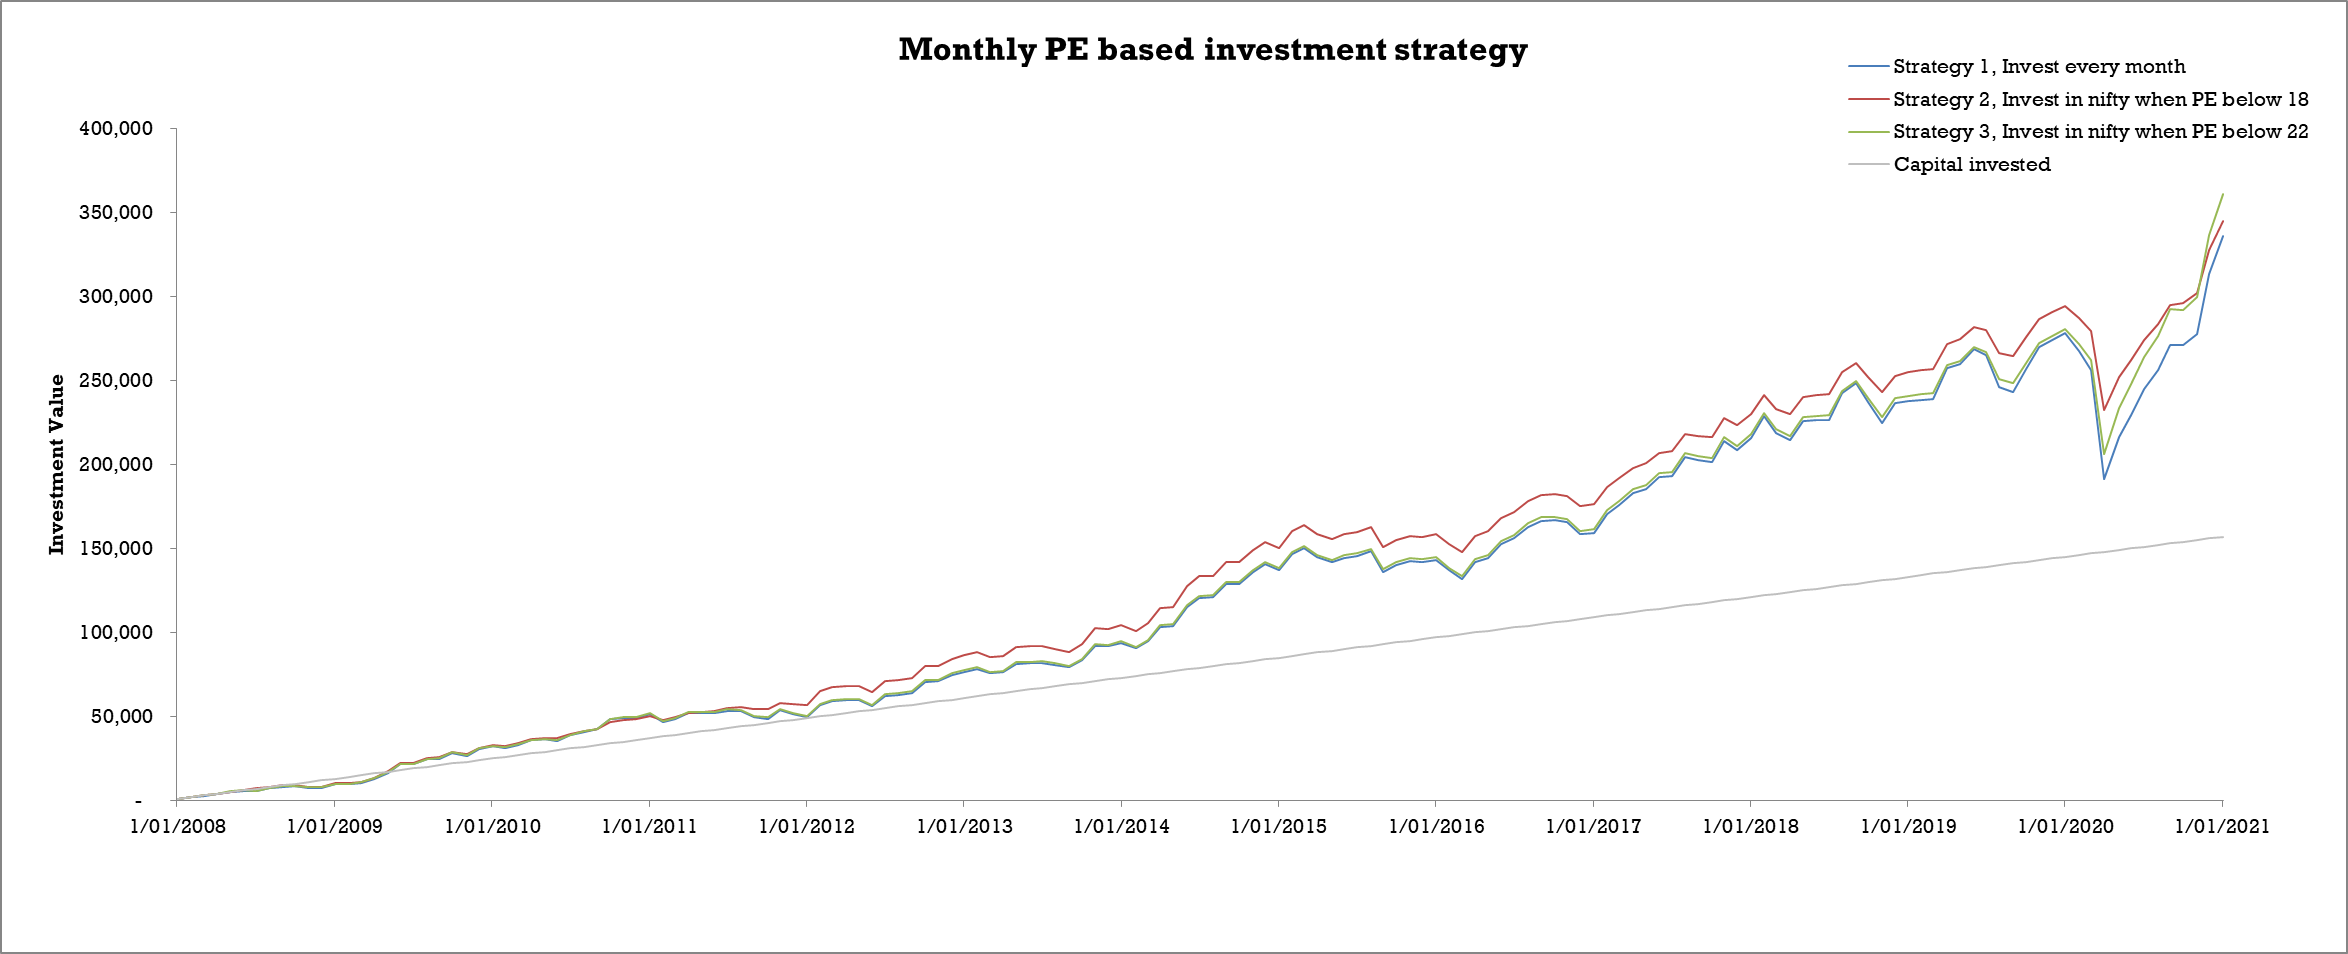
This looks even better for Strategy 2 over the entire time period. Except for the last data point, where Strategy 3 performs better than Strategy 2. Even Strategy 3 has an edge over Strategy 1 (normal SIP). This strategy has an edge over the previous strategy, especially when you start in markets that are already on a high.
Let’s see how does this strategy fare when you use 12 month moving average PE values.
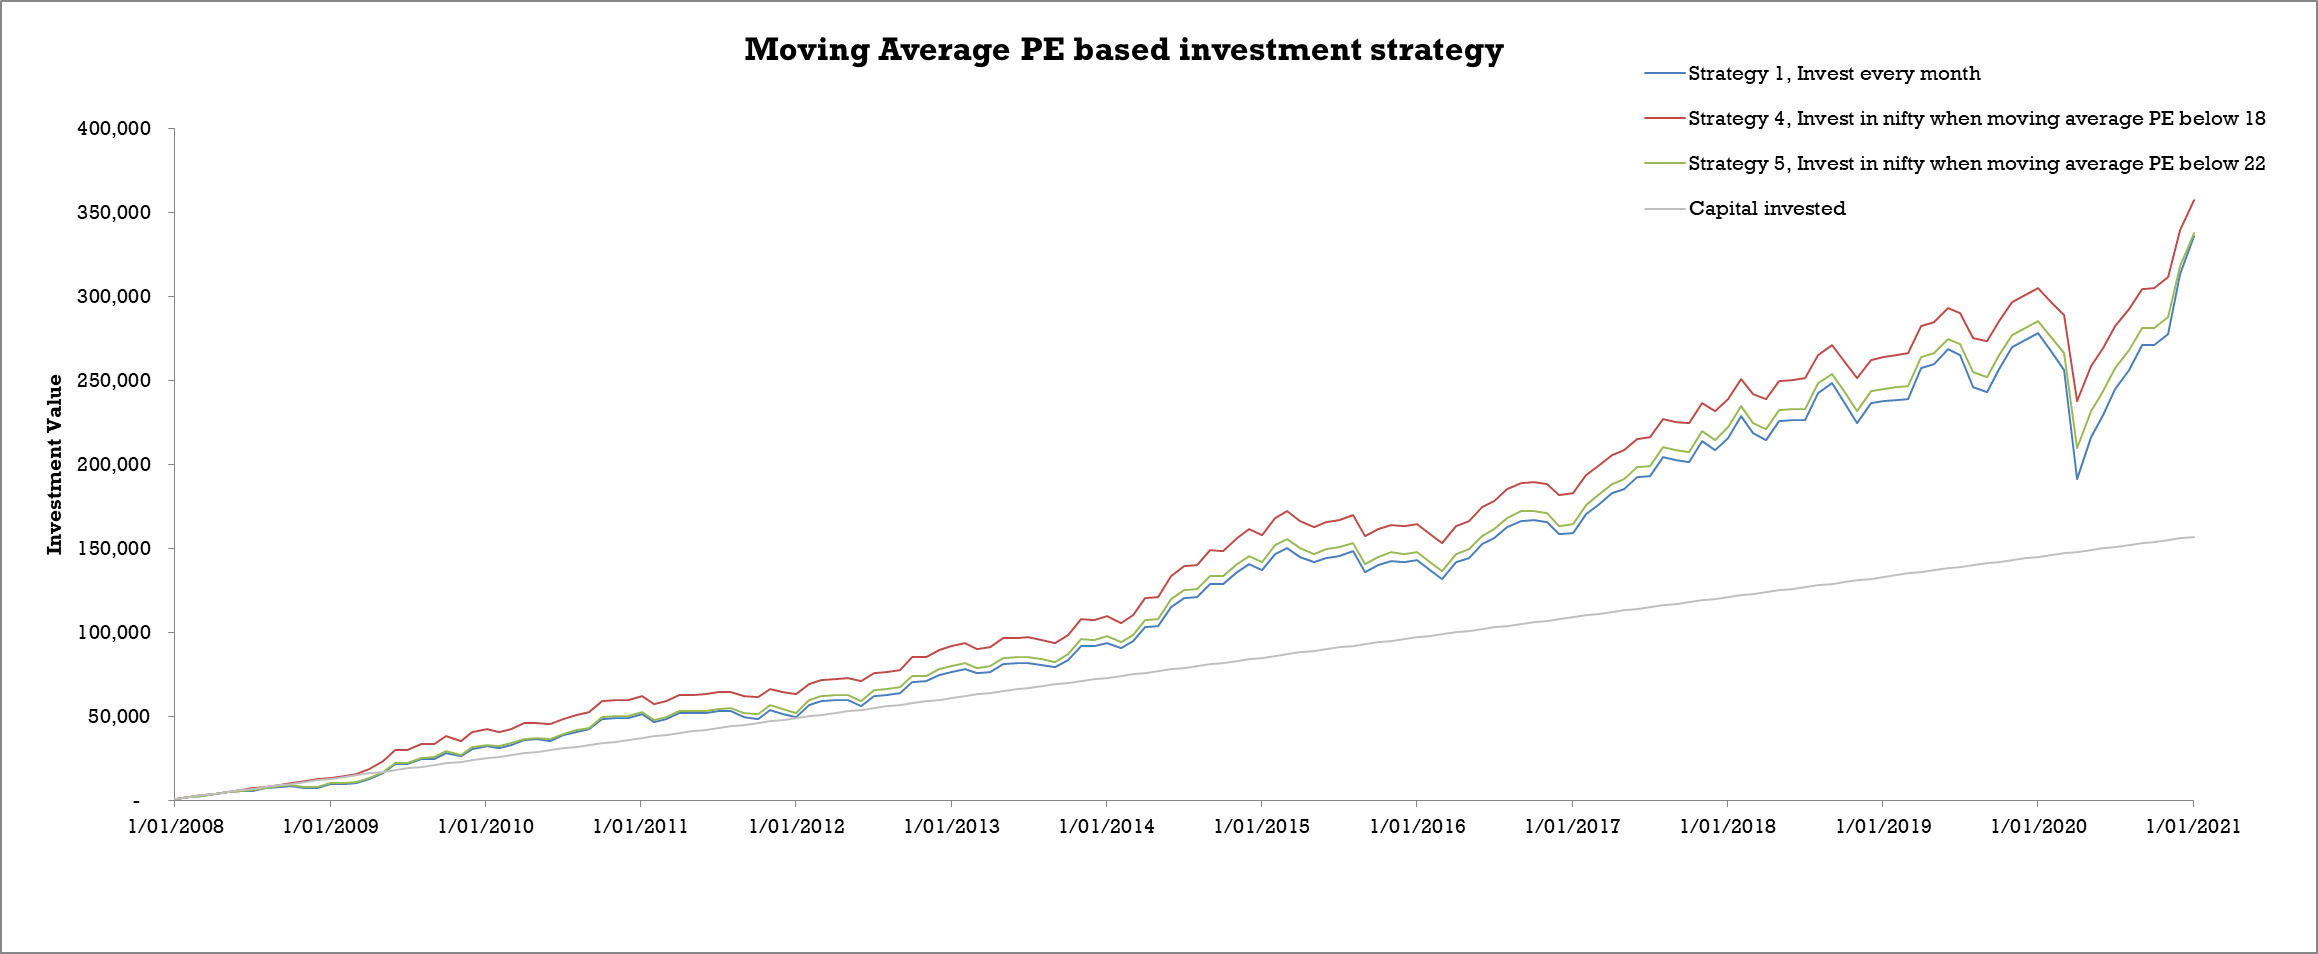
The trends hold here as well. Strategy 4 turns out to be the strongest again. Strategy 5 seems to be closer to Strategy 1 in the last year. Everything else looks similar to the previous chart.
Time to look at the final investment values at the end of 13 years.
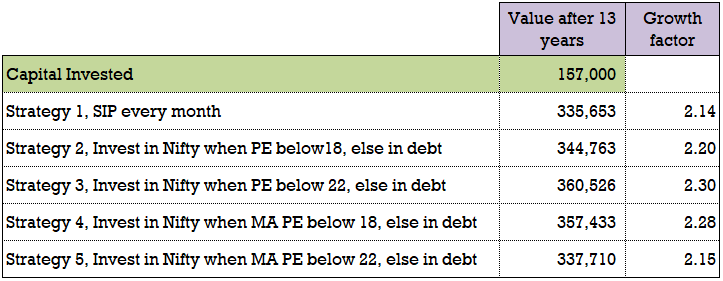
All the strategies have given a growth factor of more than 2.1 times. Strategy 3 has provided the highest growth as of January 2021. Strategy 2 and 4 have also given very good results. Overall, this strategy at a threshold PE of 18 seems to be an attractive option for investors who have the time and discipline to put it into practice.
Key takeaways:
Following are some key observations based on what we have seen above:
- PE based equity switching strategy has given superior returns when compared to normal SIP. This is irrespective of the start period of the investments.
- If the investment starts when markets are at a high, then this strategy works even better.
- When comparing the PE threshold levels of 18 and 22, PE =18 seems to be a better option.
- To sum it up, it is a good strategy for investors if they are willing to take that additional effort to regularly monitor and execute it.
Stay tuned for more !!!