

Updated on: November 25, 2020 ; Investments
Introduction:
In this second part of the second series, we continue our analysis of SIPs by focusing on midcap SIPs. If you have not read the first part, you can read it by clicking here where we analyzed the performance of largecap SIPs. The links to the first series can be found at the end of this article.
As done in the first part, we will simulate situations where an investor might find him/her after staying invested in midcap SIPs for different time periods. This will help you appreciate the effects of investment duration and investment start time much better.
We will achieve this by fixing the evaluation point of your SIPs and have different investment start time in the various scenarios. Let’s have a look at the background of the data and the approach before we start our midcap SIPs analysis.
Background on midcap SIPs:
We have considered the BSE MidCap index as our proxy, where we will compare the SIP performance of different investment scenarios in our study.
The idea is to simulate some probable situations that midcap SIP investors might find themselves in. For this, we have assumed that the investor is evaluating his/her SIP investment on November 2nd, 2020. But we will evaluate many different scenarios and each scenario will have a different SIP start date. We will be covering a big range of short-term and long-term investment durations here.
Since the BSE MidCap data is available from April 2003, so our first scenario is the one where the investor starts his SIP investments from April 2003 and continues it till Oct 2020. The investor makes a monthly investment of 1000 rupees at the start of every month without missing any payment in between.
The next scenario would be, where the investor starts his SIP investments from next year, i.e. April 2004. So each scenario represents a new SIP, starting in April of each year. This will continue till the year 2020. This leaves us with a total of 18 scenarios, ranging from 2003 till 2020. So the longest investment duration is for 17 years and 7 months, and the shortest one is for 7 months only.
In this article, we will look at these 18 SIP scenarios based on the actual BSE MidCap levels. In addition to that, we will also look at a few hypothetical cases to simulate returns at different BSE MidCap levels on the evaluation date.
Midcap SIPs cases explained:
We will be analyzing a total of six cases here. Each one of them will have the 18 SIP scenarios in them. Let’s briefly define these different cases first.
- BSE MidCap at the actual level: CAGRs computed based on the actual level of BSE MidCap (14,959) on November 2, 2020.
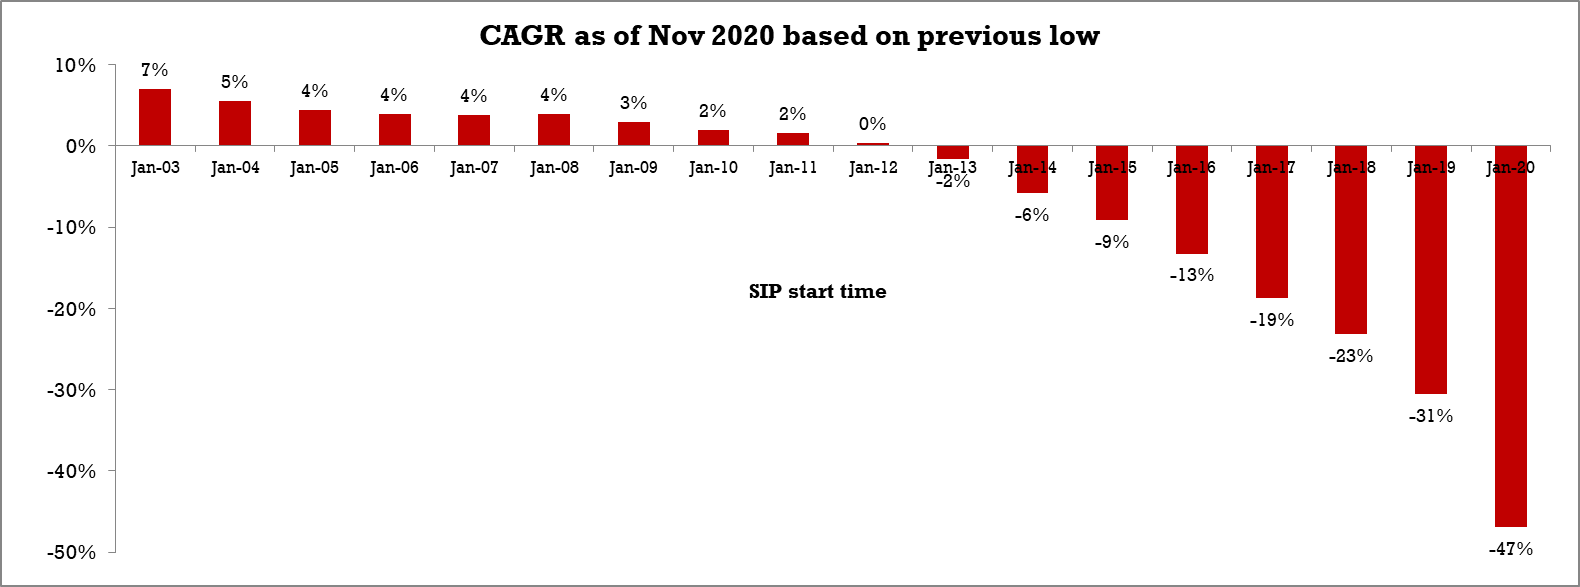
- BSE MidCap at previous low: CAGRs computed based on the hypothetical case, where BSE MidCap equaled the previous low level (in the last 12 months). In this case, it is 10,340 recorded on April 1, 2020. The actual lowest was in March, but since we are taking the data at the start of each month, this is the data point we will be using in our analysis. It is 31% lower than the actual level.
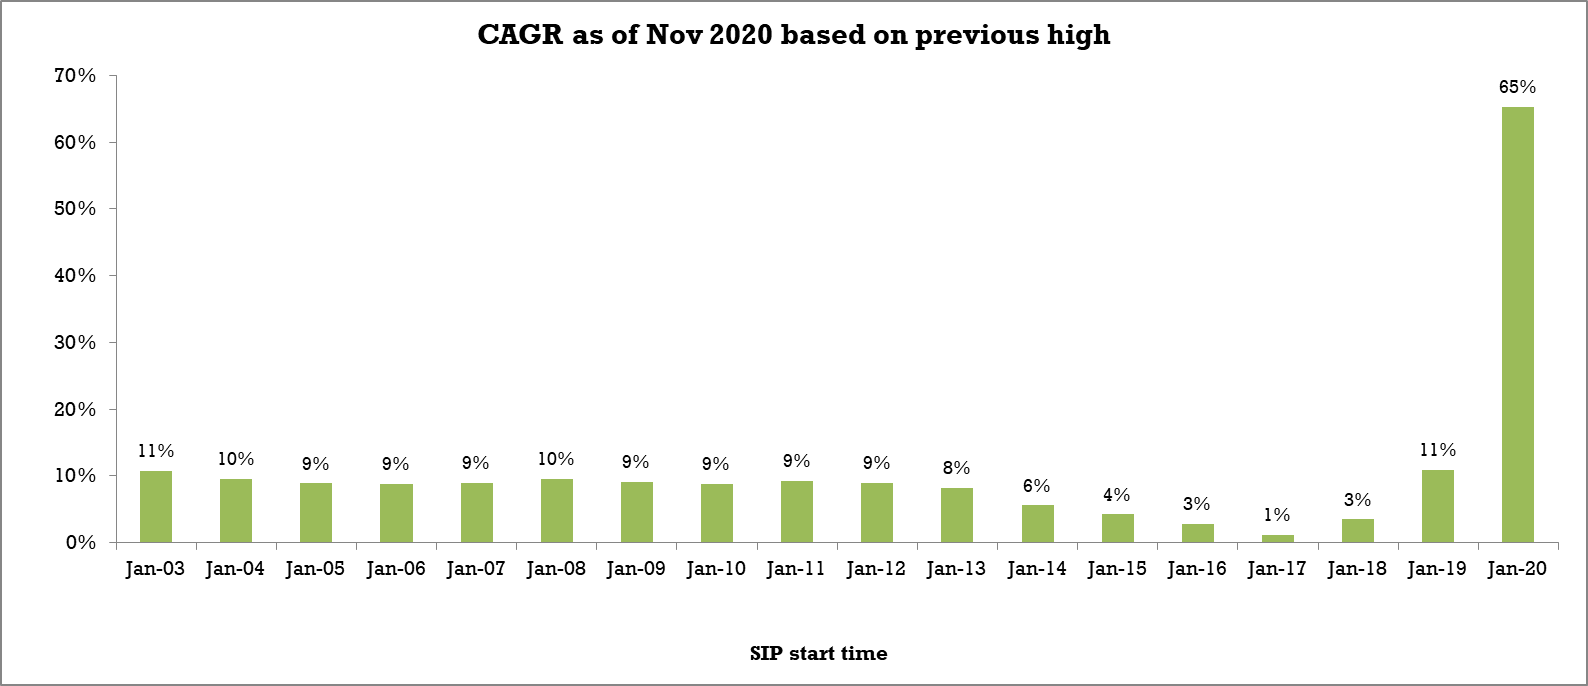
- BSE MidCap at previous high: CAGRs computed based on the hypothetical case, where BSE MidCap equaled the previous high level. In this case, it is 15,120 recorded on February 1, 2020. This is 1.1% higher than the actual level, not much of a difference here.
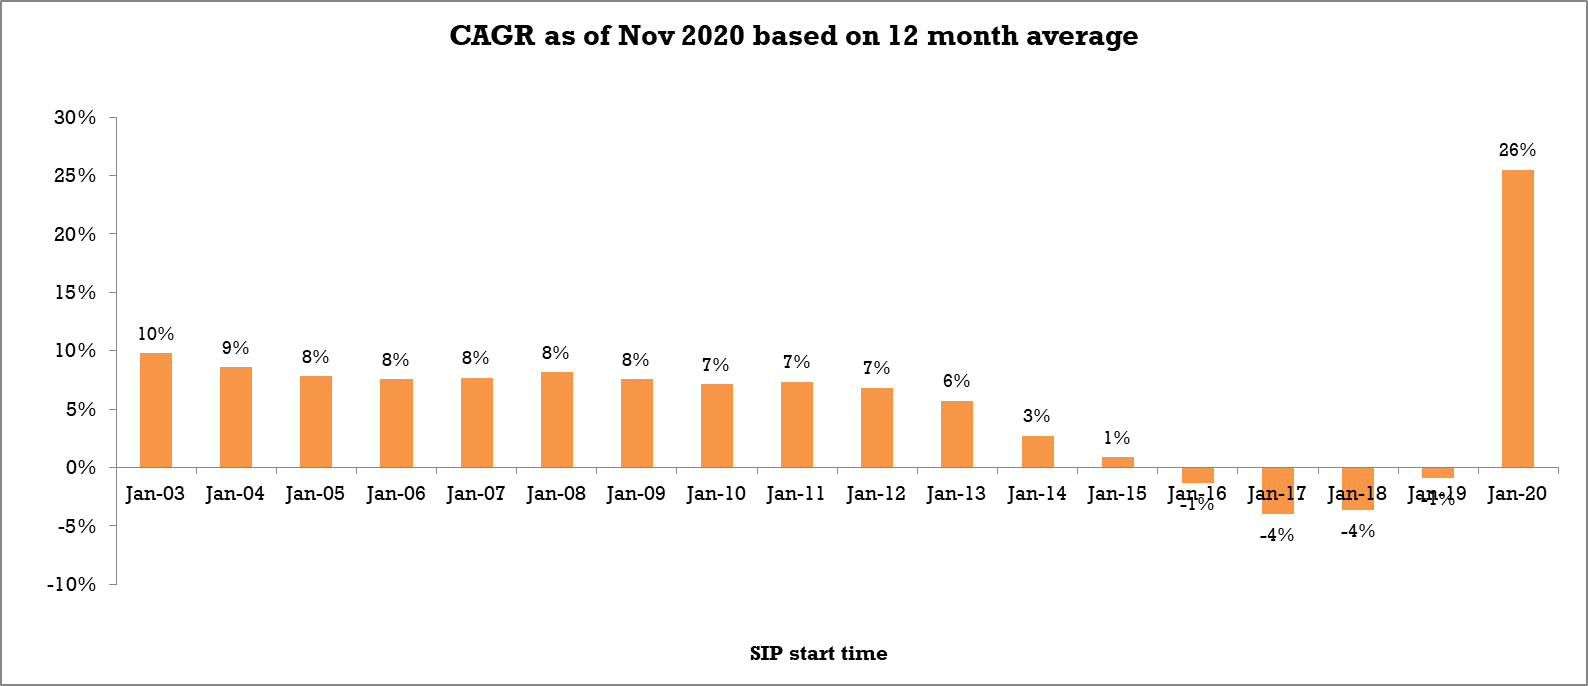
- BSE MidCap at last 12-month average: CAGRs computed based on the hypothetical case, where BSE MidCap is at the level of the last 12 months’ average. This level is 13,743, 8% lower than the actual level.
- BSE MidCap at last 24-month average: CAGRs computed based on the hypothetical case, where BSE MidCap is at the level of the last 24 months’ average. This level is 14,188 5.2% lower than the actual level.
- BSE MidCap at last 60-month average: CAGRs computed based on the hypothetical case, where BSE MidCap is at the level of the last 60 months’ average. This level is 14,087, 5.8% lower than the actual level.
Midcap SIPs cases analyzed:
Now, it’s time to look at the data and observe how the returns would look like for the different scenarios within various cases. Just a reminder before we start. We are looking at all these scenarios as of November 2020. All the scenarios have different starting points for their SIPs but they all have the same evaluation point.
We will start in the same order as mentioned above. So, let’s begin with the actual case. The graph below presents the CAGRs for different scenarios in case 1 (actual BSE Midcap level). The first bar represents the scenario where an investor had started his SIPs way back in April 2003 (investment period of 17 years & 7 months). I am not sure if this was actually possible, but we are assuming that there was a way to invest regularly. The last bar represents the shortest investment period of 7 months, where the midcap SIPs started in January 2020.
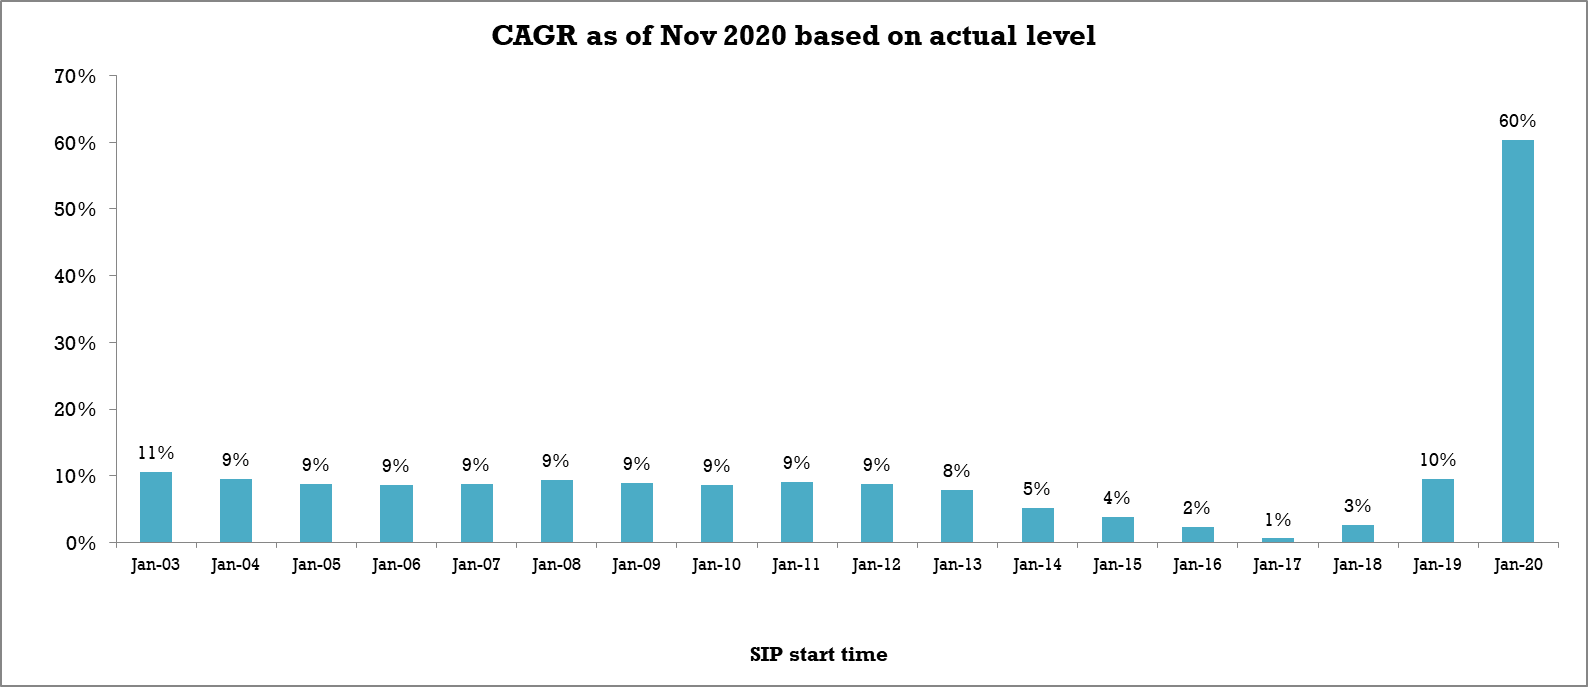
The CAGRs vary a lot depending on the investment duration. The returns look decent for the SIPs that are more than 7 years old. But after January 2014, we see a significant drop in the CAGRs till it picks up again in January 2019.
The unbelievable spike of 60% seen in the last bar is because of the great crash in March-April of 2020 and a very quick recovery seen soon afterward. This is quite unprecedented and will have to see if it is just a short term spike or it is there to stay.
There is a lot of volatility in the shorter durations. The biggest spike was seen in the last scenario, and just the previous few scenarios gave the lowest returns. Investments of duration 7 years and more seem to give a decent return of 9%+. No one can predict what the next 10-15 years would look like, but this should give a good perspective.
But what if the current level of BSE MidCap were different? We can simulate a few cases for that. Instead of randomly assigning any value, we will take some cues from the past to come up with these values. The following are the charts for the five hypothetical cases explained in the previous section. We will note down our observations once we have seen all the charts.
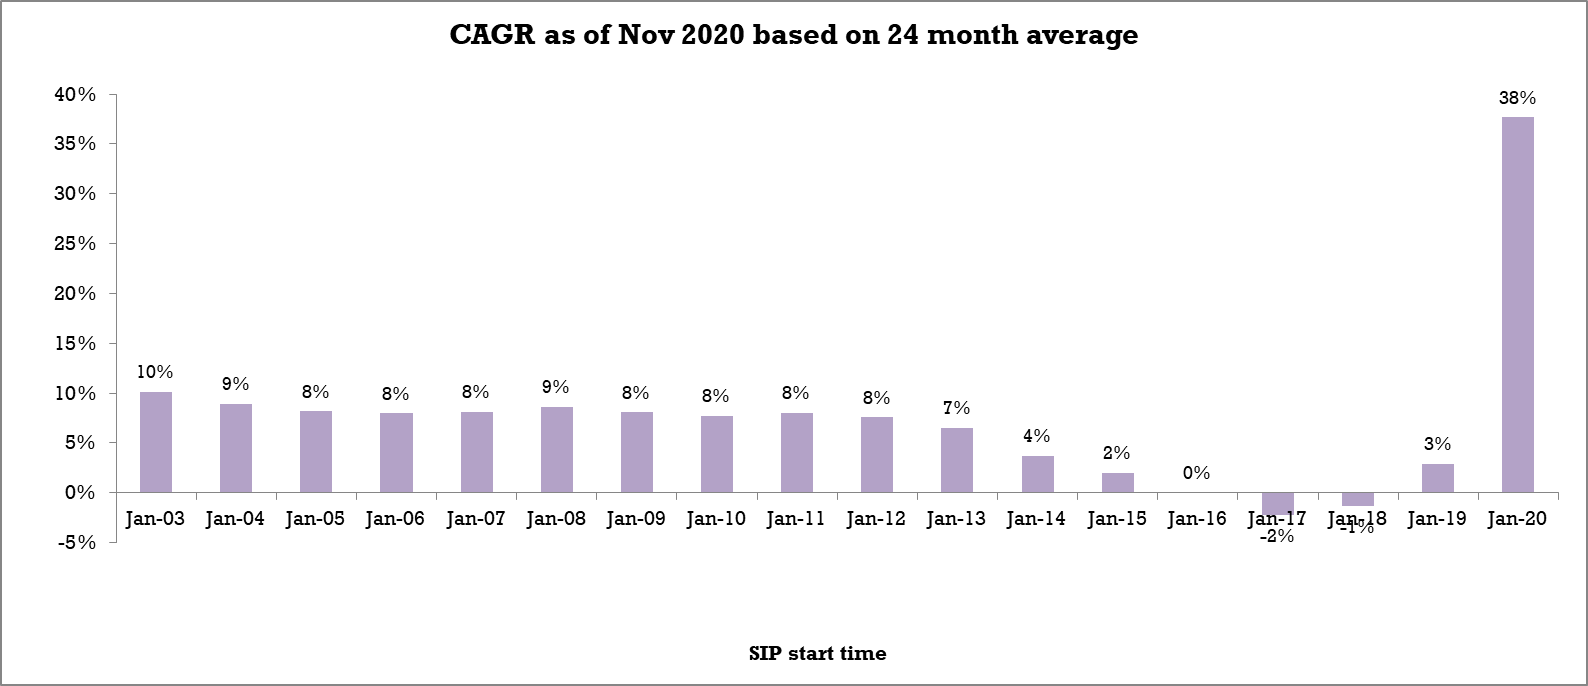
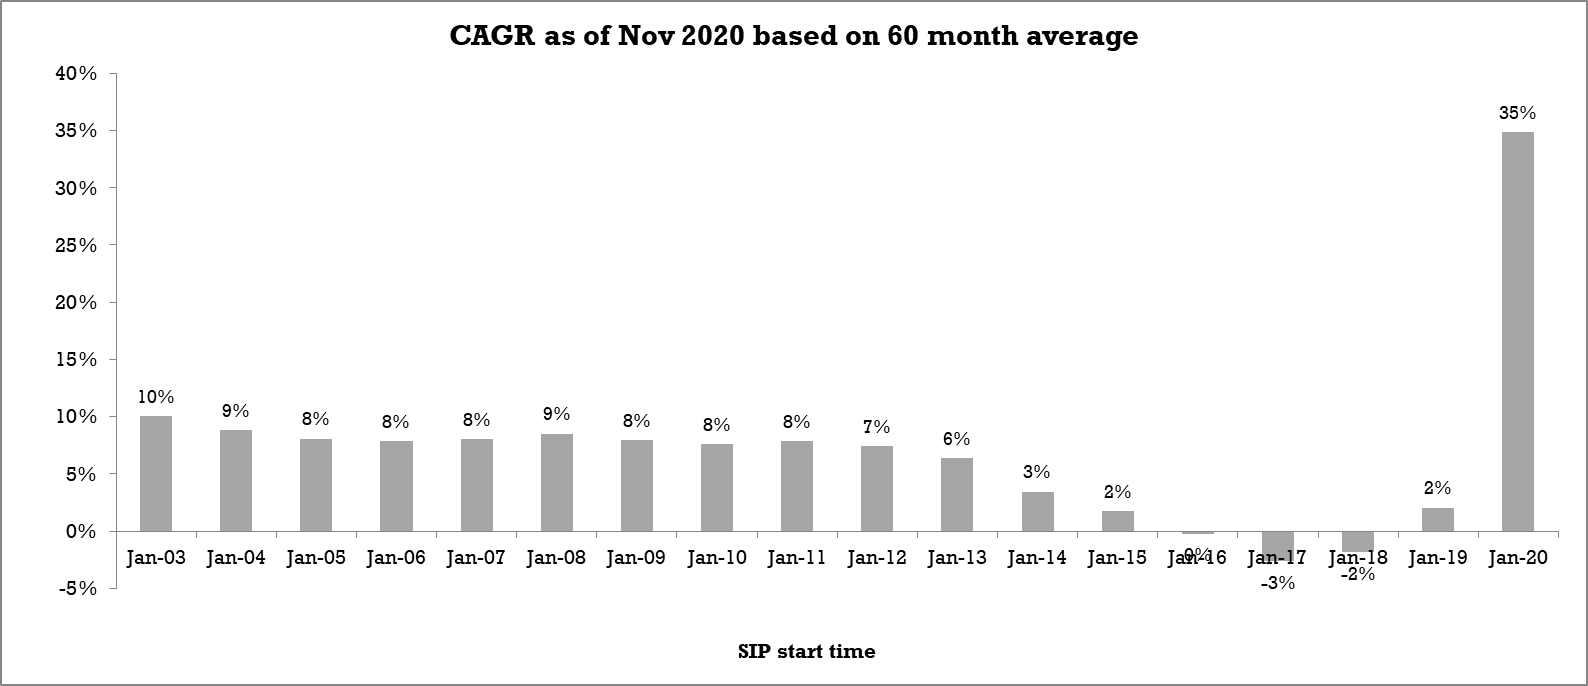
Now, there are a lot of colorful charts here. Each one of them narrates a different story. I urge you to have a look at them carefully and draw your own interpretations before I put down a few of my observations in the section below.
Key observations:
The following are some of my observations. Hope you also came up with some solid observations of your own.
- There is high volatility in the short term SIPs. Especially in the SIPs that started after January 2013-2014. You can observe this in the last few bars.
- Current market levels have a lesser impact in terms of CAGRs, on Longer-term midcap SIPs.
- The obvious point to note is that all CAGRs depend on the current market level, but the intensity of it is more pronounced on short-duration SIPs. This point is kind of summarizing the previous two points.
- In the second scenario, when the current levels were at their recent worst, even 15-years midcap SIPs had a low CAGR of 4-5% only.
- Please appreciate that one big downswing can have a very adverse impact on your SIPs. Even long durations SIPs are prone to it. The 7-year SIP (second case of previous low) which gave negative returns is one such example. There is no easy or sure shot way to avoid or predict it. But keeping yourself informed will help you manage your expectations and plan your investments better.
Conclusion:
SIPs can give different returns based on your investment duration and current market levels. They can give you lower or even negative returns despite being invested for longer periods. This can happen if there has been a big crash, or most of your SIP investments were during a bull run in the market or at higher valuations. Longer durations act as a shield to fluctuations to some extent.
We will cover the same analysis for smallcaps in the next article.
Please find the links for the first series on SIPs: Largecap, midcap, smallcap, and the comparison.
Think long term when you think of SIPs !!!
Data sourced from: https://www.bseindia.com/Indices/IndexArchiveData.html