

Updated on: May 15, 2021 ; Investments
Introduction?
In this article, we are going to explore if PE can act as an indicator to gauge the valuation of your financial assets. It will help in some of your financial decisions. We have already discussed the basics of PE in a previous article. You can read all about it here.
We will see if PE can act as an indicator for the valuation of broader markets. Can it be a leading indicator for an upcoming fall or rise in the market? For this, we will compare the historical trends of Nifty 50 and its PE levels over a time period of 21 years. Our data ranges from January 2000 till December 2020.
How is Nifty 50 PE computed?
According to NSE wesite, Nifty 50 PE is computed based on the following formula:

where, Index market capitalization of the Index constituents is the total of the outstanding equity shares or units considered for index computation multiplied by the last traded price of each index constituent adjusted for factors such as free-float, capping factor, etc. depending upon the index methodology; and
The earnings (including profits and losses) reported by each index constituent in the trailing 4 quarters (standalone financials) are cumulated and adjusted for factors such as free-float, capping factor, etc. depending upon the index methodology to arrive at the gross earnings.
Nifty 50 and PE analysis:
Let me give some context on the methodology first.
We will analyze the trends of Nifty 50 over 21 years, and compare them with the corresponding PE ratios. We have considered monthly data and taken the Nifty 50 level at the start of each month. To smoothen out the monthly variations in the market, we have taken 12-month moving average values for Nifty 50 and its PE ratios every month.
Next, we looked at the deviations of the Nifty 50 level from its 12-month moving average at each data point. This is to identify any significant upward or downward movements of Nifty 50 from the prevailing trend. We then recorded the 12-month moving average of PE ratios at these points.
The idea is to see if we can find any relation between the fall and rise of the Nifty 50 level and the corresponding PE levels. Can these PE levels act as indicators of upcoming rise or fall in the market?
Now, coming to the actual analysis.
We start by looking at the historical Nifty 50 trends first. The chart below traces the monthly Nifty 50 levels from January 2020 till January 2021. First, we look at the big falls in the market. For that, I have marked the points where the market fell more than 12% from its 12-month moving average.
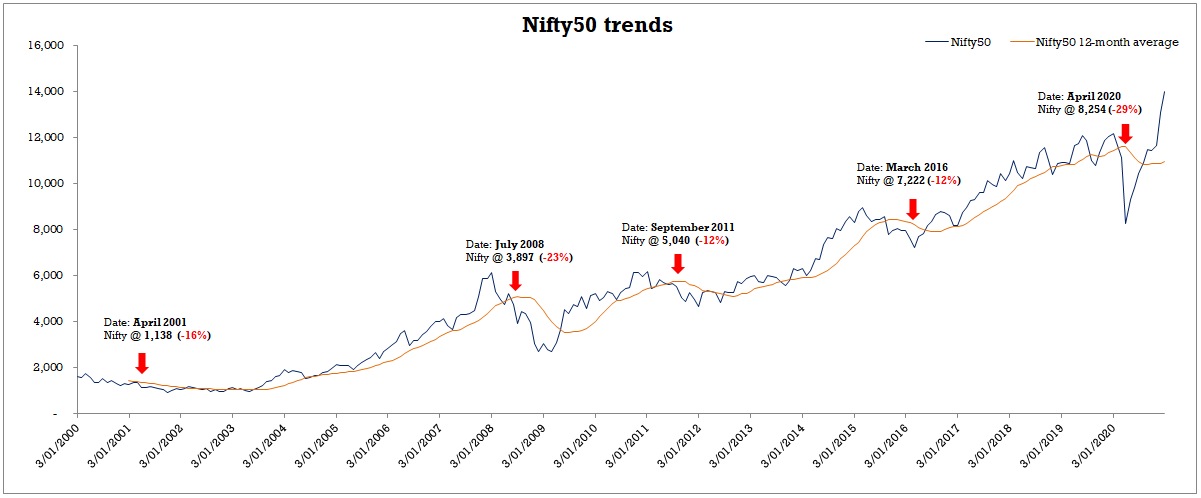
There were 5 such instances recorded in the chart above. The first one was in April 2001 when the market fell by more than -16%, and the last one was in April 2020 when it fell by -29%.
Please note, these declines represented in the chart are the drops registered in that month only. These are just the starting points of longer periods of fall. The market fell further in the following months in each of these instances. So, please don’t consider these declines as the measure of total fall during these bear periods.
Now, it is time to have a look at the PE ratios at these 5 instances. The following chart shows the PE trends and its 12 months moving average.

The PE was at 21.2 at the time of the first drop. When the market fell in the next three instances, PE was lingering around 22.4. The final drop happened around 28 PE levels. I have also put a line to mark the PE @ 22 for better visibility. You can clearly notice that on the second, third, and fourth instance, every time PE crossed 22, the market fell within a few months to a couple of years. But this pattern doesn’t hold good during the fifth instance.
So, PE crossing 22 can be an alarming indicator, but it is not consistent and can’t be relied upon solely. As mentioned in the previous article, PE is a very useful tool, but it should not be used just on its own for making any financial decisions.
You need to consider other factors before making any decision. Markets price stocks in anticipation of future earnings and opinions. So, a high PE level doesn’t always mean overvaluation, especially in the cases when the market is coming out of a low earnings phase, and expected to grow at a higher than usual rate.
Having said that and having looked at the limited data of 21 years, PE @ 22 levels seems to be a good point when an investor should seriously start assessing their investments in the broader market indices like Nifty 50.
We have looked at PE as an indicator for higher valuations. But, can PE levels signal undervalued markets as well? Can it be used to decide the right time to invest in the market? To answer these questions, let’s look at the other side of the story – Rising markets.
The chart below marks the points when the Nifty 50 level rose above its 12-month moving average by more than 12%.
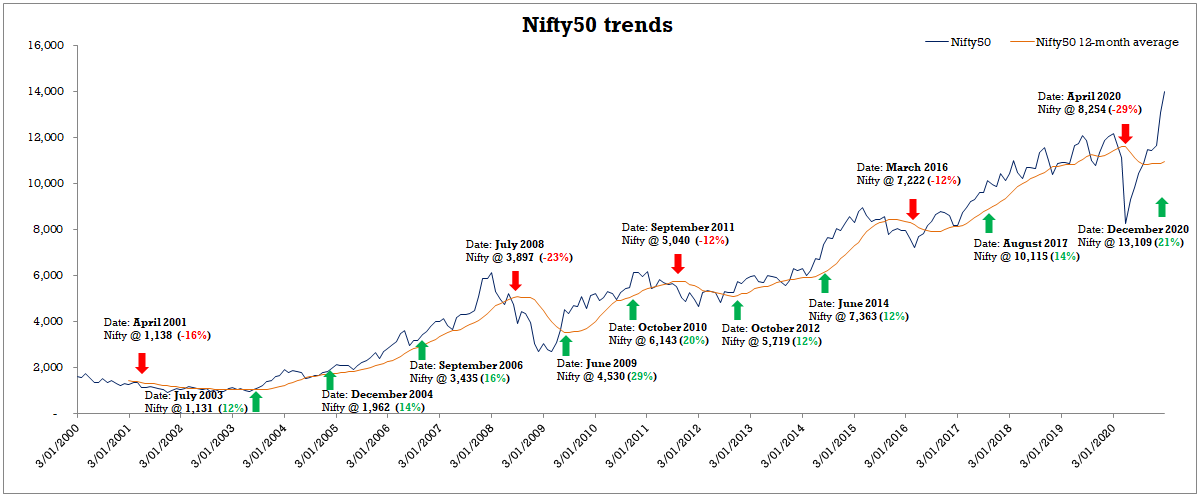
You will notice that on a few occasions, a big fall in Nifty 50 was followed by two or three upward rallies. These positive rallies are well spread across the 21 years time horizon. Let’s see what the PE ratios look like at these points and figure out if there is any pattern.
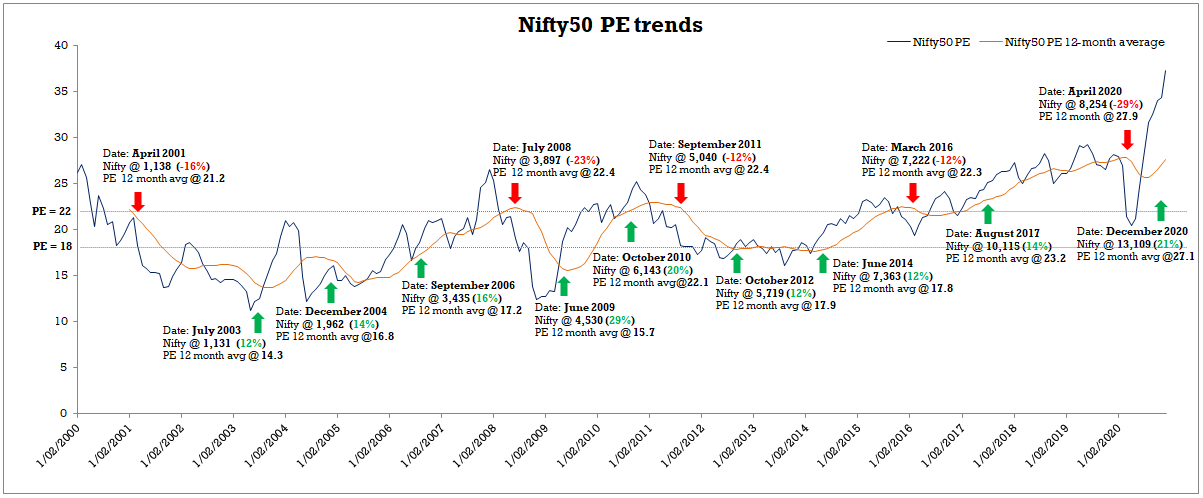
The PE ratio ranges from 14.3 to 27.1. In six out of the nine instances, PE levels were below 18. But three of them, especially the last two were above 22. Now, this might seem to conflict with what we have observed in the case of PE during the market declines.
How can PE above 22 mark the beginning of the rise in the market levels? Markets are not governed by just any single factor. Markets are driven by sentiments and future expectations in addition to the fundamentals. To add to it, we can’t deny the role of rumors and manipulations at times. To sum it up, markets are not rational all the time.
There is no clear pattern to PE that can indicate the start of rise in market levels. We can loosely say that PE below 18 can be a good time to start considering investing in the markets (Nifty 50). But waiting for PE @ 18 to start your investments might lead to opportunity loss for investors.
Closing comments:
PE can be a good indicator to mark the start of bear or bull phases. They can’t be solely relied upon but can act as one of the many good guides. PE @ 22 seems to be a better indicator of upcoming fall in the market than PE @ 18 as an indicator of upcoming rise.
In this article, we looked at the PE for a broader market index. The PE levels that we have highlighted are specific to Nifty 50 only and should not be applied to any other financial asset. Each stock or index will have its own PE story that you need to discover.
In the next few articles we will explore if we can devise any investment strategies based on PE.
Keep a watch out for PEs!